3.1.2 Findings
3.1.2 Findings
The survey set out to investigate 14 specific questions which were themed on the following:
1. Local Parks
2. Other Parks
3. Concerns, Activities and Impressions
4. Value of Parks and Volunteering
5. Respondent Characteristics
Theme 1: Local Parks
Question 1: What is your local park / What street is it on?
Most people’s opinion on parks will be influenced by their local park, with which they are most familiar. This question was responded to by over 97% of respondents.
Question 2: How often do you visit?
The question was answered by over 98% of respondents.
The majority of respondents use their local parks on a weekly basis (42%) and on a daily basis (26%). This indicates that parks as a resource in the City are frequently used by the majority of the population, with only 2% stating they never use their local park. The returns indicate that parks are a valuable assetto the city.
Question 2a: When visiting, where do you travel from?
The majority of the respondents travel from their home (90%) with only 4% from the work place and a surprising low 1% from schools/colleges.
This reinforces the importance of parks to the resident population, however with the city serving as a major place of employment a higher usage by city workers would be expected.
Accessibility may be a factor in a low return for usage by the work force. There also appears to be an opportunity for greater participation/use from schools and colleges of local parks where education programmes could be explored and developed.
Question 2b: How long do you normally stay?
The majority of park visitors stay for more than 20 minutes (61%) while 28% stay between 5 and 20 minutes.
This is a positive result and indicates that parks are places that the majority of people want to spend time in.
Question 3: How long does it take to get there?
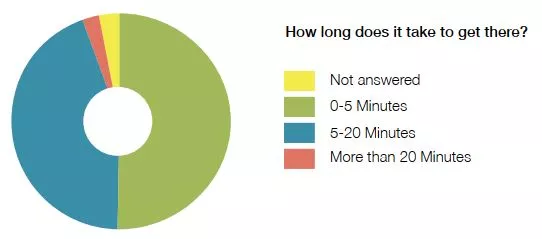
50% of respondents indicated that it took up to 5 minutes to get to their park while 44% indicated it took 5 to 20 minutes.
This indicates a reasonable travel distance for about half the population. As a rule of thumb, 5 minutes equals a walking distance of approximately 300 to 500 meters. 5 to 20 minutes presents a longer distance and could pose problems to those with children and disabilities. The closer park resources are to the population, the greater the value they are to them. Improving access to parks and the facilities they contain is examined further in the next section

Question 4: How do you get there?
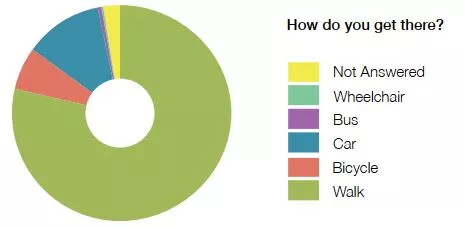
Walking is the most frequent mode of transport to parks at a high 79%, followed by car at 12% and bicycle at only 6%. This indicates that transport modes used to go to parks are highly sustainable. It also indicates that accessibility by bicycle is preferably improved.
Access by cars at 12% indicates a need to allow for parking near parks. Access by wheelchair is low at 0.2% and on review of this particular group of respondents, it is noted they all indicated barriers to visiting parks. Use of most forms of public transport to go to parks is also quite low according to the survey returns.
Accessibility standards for parks are based upon reasonable walking distances from residents’ homes. It is therefore helpful to confirm that the majority of people walk, as it supports the methodology.
Where possible more sustainable means of travel to parks should be encouraged, not only for environmental reasons but also as there is normally only limited car parking available.

Theme 2: Other Parks
Question 5a: Do you visit other parks in Dublin?
The majority of the population visit other parks (90%) besides their own local park. In the main, parks such as the Phoenix Park, St Stephen’s Green, Iveagh Gardens, Merrion Square, Herbert Park and St Anne’s figure prominently as destinations, with the Phoenix Park being the most popular other park destination.
The stated reasons why people go to other parks are variable, however dog walking, events, bringing children to the park or running are frequent responses, with park size and quality being important.
It is important to note that most stated reasons are for some form of active recreation, which underlines the importance of parks and green space for healthy communities. It is also notable that the majority of these parks are of ’flagship’ status under this Strategy.
Question 5b: How often do you visit other parks?
Respondents visit other parks occasionally (35%), weekly (34%) and monthly (20%) which overall is less frequent than their local parks visits. Again this highlights the importance of highly accessible local parks forming the broader community resource for a city parks hierarchy.
Theme 3: Concerns, Activities and Impressions
Question 6: Does anything prevent you from visiting any parks?
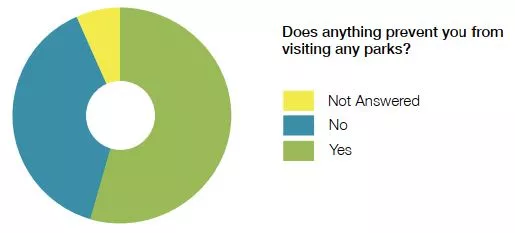
55% of respondents considered that something does prevent them from visiting a park.
The key responses given were vandalism/antisocial behaviour (30%), dog fouling/control (20%), lack of facilities in parks (19%), safety concerns (17%), distance (14%), other reasons (10%) barriers to getting there, e.g. roads or bridges (6%), disability (0.7%).
Other reasons stated included issues with park opening times, events held in parks and difficulty parking.
Anti-social behaviour was highlighted as a significant issue. The percentage affected is relatively large when considering the whole population and highlights, in particular, issues on the policing and control of public open space.
It is interesting to note the 20% response rate preventing people visiting parks due to dog fouling/control is in contrast to the 27% (in Question 7) who state walking the dog as their reason for visiting parks.
A range of solutions will require consideration to satisfy both camps including stricter control on leash requirements and dog fouling, fenced dog run/off-leash areas, better provisions for dog waste disposal and possible dog-excluded parks

Question 7: What do you do when visiting parks?
The majority of respondents stated passive recreation activities in their replies, including walking (89%), relax/peace & quiet/fresh air (68%), enjoy flowers & trees (62%) enjoy nature & wildlife (48%) and meet friends (37%).
Active recreation responses were however not insignificant with answers of sports; football games (19%), jogging (24%), cycling (26%), keep fit exercise/health (30%), bring kids to playground/play (43%)being the most prominent. Other prominent activities stated include photography and reading.
The results indicate the importance of providing parks with a balance of facilities to serve the majority of the population and avoidance of excessively large areas with a single function. This is an issue in some city parks where there is a high level of provision of pitches to the detriment of other activities and uses. The results indicate the importance of providing space in parks for all recreation types and to promote healthy communities.
The results also reveal the underlying importance of parks that appeal to certain sectors of communities, such as families with children, sports clubs and dog owners, for example.
Question 8: What is your overall impression of the quality of your local park in Dublin?
The overall impression is that Dublin parks are of good (39%) to very good quality (27%). This is a positive result but indicates room for further improvement. Only 7% indicated a poor to very poor result
Question 9: How would you rate the following ?
Design & appearance of parks:
|
Very good |
28% |
|
Good |
42% |
|
Fair |
17% |
|
Poor |
6% |
|
Very poor |
4% |
|
None |
2% |
Cleanliness & maintenance:
|
Very good |
24% |
|
Good |
37% |
|
Fair |
20% |
|
Poor |
7% |
|
Very poor |
8% |
|
None |
1% |
Range of facilities available:
|
Very good |
12% |
|
Good |
27% |
|
Fair |
28% |
|
Poor |
15% |
|
Very poor |
10% |
|
None |
6% |
Trees & planting:
|
Very good |
31% |
|
Good |
38% |
|
Fair |
16% |
|
Poor |
6% |
|
Very poor |
4% |
|
None |
1% |
Wildlife/nature:
|
Very good |
22% |
|
Good |
29% |
|
Fair |
23% |
|
Poor |
10% |
|
Very poor |
7% |
|
None |
6% |
Seating/lighting/signage:
|
Very good |
10% |
|
Good |
26% |
|
Fair |
28% |
|
Poor |
15% |
|
Very poor |
12% |
|
None |
6% |
Sports facilities:
|
Very good |
13% |
|
Good |
27% |
|
Fair |
19% |
|
Poor |
9% |
|
Very poor |
5% |
|
None |
15% |
Playgrounds:
|
Very good |
21% |
|
Good |
31% |
|
Fair |
17% |
|
Poor |
6% |
|
Very poor |
5% |
|
None |
15% |
Art:
|
Very good |
5% |
|
Good |
7% |
|
Fair |
13% |
|
Poor |
17% |
|
Very poor |
10% |
|
None |
42% |
Based on these results the key areas of concern and areas for improvement are in the range offacilities, seating/signing/lighting, sports facilities, playgrounds and art. There may be a greater need to consult with sports groups and schools to further establish the need for sports facilities
Question 10: What recommendations would you suggest for your local park?
This open ended question was answered by over 84% with a variety in the responses given. Common recommendations included, better areas for surveillance, a better variety of play equipment for different age groups, additional seating, cafés, toilets, events and art and more control of dogs and anti-social behaviour.
A large number of answers were park specific, which is useful information for future park upgrades and improvements.
Theme 4: Value of Parks and Volunteering
Question 11: What do you consider is the value of all parks to Dublin?
The majority of respondents (93%) answered this question with recreation as the main value, followed by greening and peace/tranquility.
It is also worth noting that some of the respondents stated a lack of private residential open space and the significance of parks to city (apartment) living. Yet again the points raised in Section 2 on the value of parks to Dublin City have been raised and supported by the views of the community survey.
Question 12: Would you consider volunteering in parks?
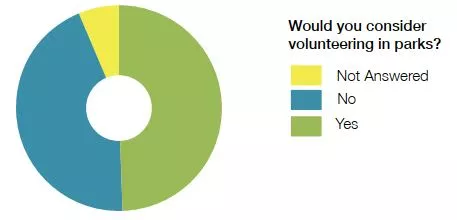
This question was answered by 94% of which 50% said yes and 44% said no.
Half the respondents indicated a significant interest in volunteering, which is a positive outcome for successful community engagement in parks services and programmes. When asked what areas of volunteering they would like to engage in, most responded with cleaning or planting activities. Volunteering is discussed further in the next section.

Theme 5: Respondent Statistics
Question 13: About you.
A series of questions was asked to help profile the respondents including age, gender, ethnic/ cultural group, nationality, where respondents live, work or study and their use of social media.
The results indicated that the average respondent is 25 to 44 years old, female, Irish, living and working in Dublin City.
Nearly 40% of respondents were male, and 58% were female.
91% of respondents live in Dublin city with 6% answering as not living in the city. Finally, 70% worked in Dublin, 15% were students and the majority used social media.
Question 14: Any other comments?
This question was answered by 56% of respondents. In the main, the comments were positive with a general sense that people are happy with park provision and resources.
Again, some respondents expressed concern at the amount of anti-social behaviour and control of dogs. Some park specific recommendations were also made.
General Findings
The response rate to the online questionnaire is low for the older age group. This may reflect the level of familiarity with information technology, as the majority of questionnaires were filled out online.
When age, gender, ethnic/cultural group and nationality are compared to the CSO national data for the same characteristics it is found:
- The survey response is not similar in age distribution with a much lower response percentage in the younger and older age groups.
- The survey response is not similar to CSO data in terms of gender, with a higher female response.
- The survey response is almost similar for Irish nationality (88% compared to 83% for CSO) but does reflect the full range of nationalities or population make-up percentage of other nationalities in CSO data.
Overall the questionnaire gives useful data and opinions which are directly relevant to the formation of the strategy policy and actions discussed in later sections of this report.