4.1.5 Quantity of Parks
4.1.5 Quantity of Parks
Within the Dublin City Council administrative area, there are 13 Flagship Parks, 59 Community Grade 1 Parks and 228 Community Grade 2 Parks.
|
Park Typology Area (ha) |
Total Area |
Central |
North Central |
North West |
South Central |
South East |
|
Flagship |
1305.79 |
1.73 |
505.77 |
726.62 |
40.43 |
31.24 |
|
CG1 |
278.31 |
7.56 |
75.33 |
81.12 |
48.44 |
65.86 |
|
CG2 |
438.13 |
4.12 |
130.21 |
131.73 |
126.64 |
45.43 |
|
Total Park Area |
2022.23 |
13.41 |
711.31 |
939.47 |
215.51 |
142.53 |
|
Total Land Area |
11764 |
960 |
3294 |
3196 |
2003 |
2311 |
|
Park Typology % Area |
Total DCC |
Central |
North Central |
North West |
South Central |
South East |
|
Flagship |
11.10 |
0.18 |
15.35 |
22.74 |
2.02 |
1.35 |
|
CG1 |
2.37 |
0.79 |
2.29 |
2.54 |
2.42 |
2.85 |
|
CG2 |
3.72 |
0.43 |
3.95 |
4.12 |
6.32 |
1.97 |
|
Total |
17.19 |
1.40 |
21.59 |
29.40 |
10.76 |
6.17 |
|
Population (Census 2016) |
Total DCC |
Central |
North Central |
North West |
South Central |
South East |
|
Population |
554554 |
72982 |
131445 |
119886 |
109065 |
121176 |
|
Flagship (m²/pers.) |
23.55 |
0.24 |
38.48 |
60.61 |
3.71 |
2.58 |
|
CG1 (m²/pers.) |
5.02 |
1.04 |
5.73 |
6.77 |
4.44 |
5.44 |
|
CG2 (m²/pers.) |
7.90 |
0.56 |
9.91 |
10.99 |
11.61 |
3.75 |
|
Total (m²/pers.) |
36.47 |
1.84 |
54.11 |
78.36 |
19.76 |
11.76 |
|
Census 2011 |
527612 |
67309 |
67309 |
125597 |
113625 |
104685 |
Parks form just over 17% of the land area of the city, that is some 2,020ha of the 11,761ha available. Flagship parks form the bulk of the provision due to the extensive size of the Phoenix Park, Bull Island and St. Anne’s Park. The remainder is community Grade 1 and 2 parks. When compared internationally the provision in Dublin is good, however it is important to look towards the future and expect the city population to continue to grow with associated demand for recreational space. The protection of existing open space is therefore crucial to meeting both current and future recreational demands.
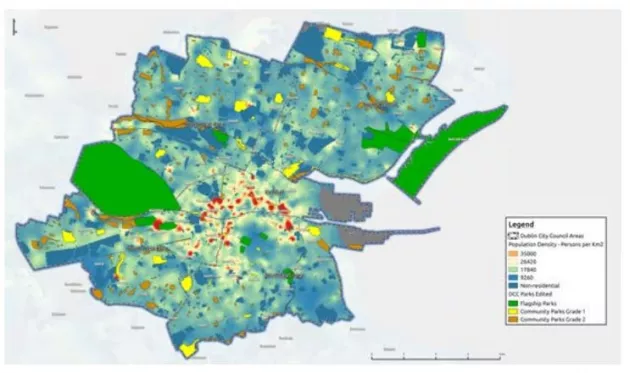
The density of residential population within the administrative area varies. A notable higher density zone is located in the inner-city between the canals as indicated (red & orange areas) on the map below. Between 1991 and 2011 the population of Dublin City increased by just 9.8 per cent. However, in the inner-city there was an increase of 62% in the same period. This increase reflects the high level of apartment building there from the late 1980s onwards. Apartments typically have less open space for occupants compared to individual houses and herefore there is a greater need for good access to public open space.
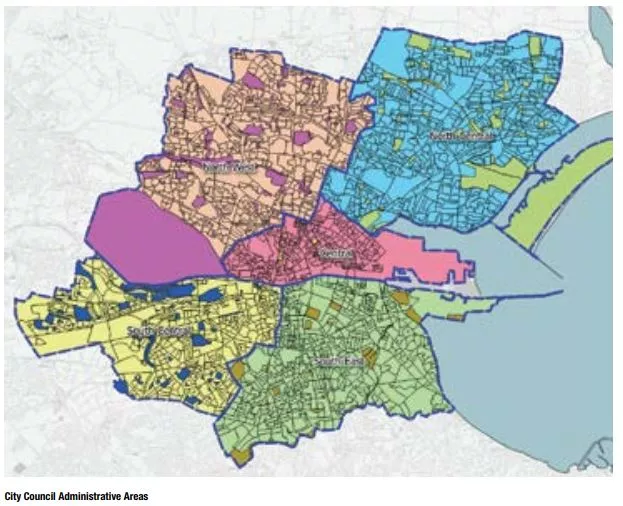
The geographic location and size of parks are not uniform throughout the city, which reflects the organic growth of the capital over many years. In order to quantify their distribution more clearly, analysis of the 5 management areas (Central, North Central, South Central, North West and South East) within the city has been conducted in terms of total park area.
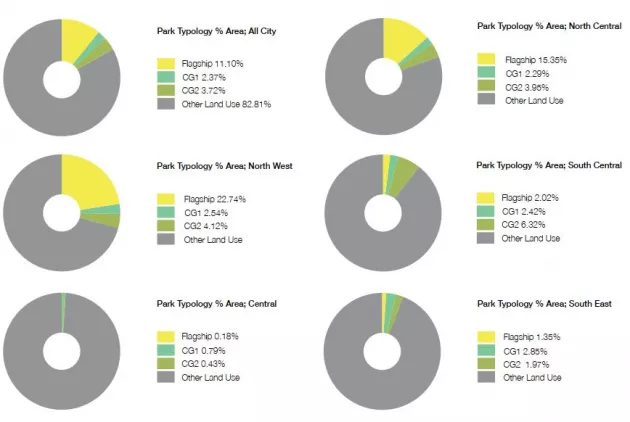
As can be seen in the diagrams above, the North West and North Central areas indicate the highest percentage area of flagship parks in the city at 22.7% and 15.3% respectively, whereas the Central Area has 0.18%. However, it is noted that the high percentage in the North West area is due to the large area of the Phoenix Park. The provision for Community Grade 1 and 2 parks ranges from 4.82 % to 8.74%, except for the Central Area, which has a low 1.22%.
In terms of total provision, the Central Area has the lowest parks provision at 1.40%,compared to 29% for North West and 21% for North Central. Taking account of the entire city, parks area per 1,000 population indicates a total provision of 3.64 hectares or 36m2 per person. Based on the recommended standards for local authorities of 2 – 2.5 hectares per 1,000 population (20-25m2 per person) as indicated in the Sustainable Residential Development in Urban Areas (2009) and the guiding figure of 18 hectares per 10,000 population in the 1987 Parks Policy for Local Authorities, the aforementioned figure represents an above average provision.
The Central and South East areas fall below this average where the provision is 1.84m2 per person and 11.76m2 per person respectively. The South East area has in fact a lot of open space but this is in private or institutional use and may or may not be freely accessible.
The size of parks is not uniform. Fewer and smaller parks are located in the inner-city where there is a higher population density. While the average provision of open space per person is 36m² per person city-wide, this reduces to less than 5m² per person in the city centre area excluding the Phoenix Park.
The inner-city, between the canals is therefore deficient both in community open space and public recreational resources due to the small unit size of the parks.
The key measures identified to address open space deficit and small park unit size are as follows:
- Create new parks by rezoning lands within the city centre. This requires a review of existing vacant lots or derelict sites to determine current potential to convert land use.
- Land ownership, value and accessibility. Conversion of private open space to public open space. This potentially includes
- Combining smaller open space provision from individual developments into large more meaningful units of open space through land swap arrangements or financial contributions in lieu of open space.
- To seek financial contributions in lieu of open space provision for proposed developments in areas outside the city centre already adequately serviced by open space and to deploy these funds to provide or upgrade parks in inner-city deficit areas.
- To enhance the general public realm quality of the inner-city to compensate for the lower provision of parks.
- Fitzwilliam Square, Mount Pleasant Square, Kenilworth Square and Brighton Square.
A study is required to identify potential new parks between the canals to address the existing lower provision of public open space there. These new parks would represent an investment into the liveability of the city. It is recommended that their design and park name reflects Dublin contemporary literature to reinforce the UNESCO City of Literature designation and to commemorate writers who had a connection to the city.
Policy
Dublin City Council will maintain a provision of between 2.5ha and 3.6ha of parks per 1000 population in its administrative area. This accommodates the existing provision while allowing for expected future population growth.
Actions
To undertake a feasibility study into facilitating public access and the provision of new parks between the canals to service this area of high population density and to contribute to the identity of Dublin as a City of Literature