2.2 - Quantitative Data Underpinning the Core Strategy
2.2 - Quantitative Data Underpinning the Core Strategy
This section summarises the key quantitative data used to inform the preparation of the core strategy. The two key sets of figures, required to input to the core strategy, are population and housing. In this regard, the key data sources are:
- Eastern Midland and Regional Assembly: Population Allocation for Dublin City Council (July 2020);
- Department Housing, Local Government and Heritage, Housing Targets for Dublin City Council (December 2020).
The other main sources of quantitative data under this section include an analysis of the Dublin Housing Taskforce (DHTF) Returns for Dublin City Council, which reports on residential planning and construction activity, and the Central Statistics Office (CSO) data on population, housing and employment figures, as interpreted by both ESRI and AIRO. The CSO Census of 2016 (including the most recent CSO annual regional area population projections published August 2021) and the quarterly CSO Local Authority Area New Dwelling Completions also inform the core strategy.
2.2.1 Population and Housing Delivery
Population Growth Patterns
The population of Dublin City has increased on average by approximately 5% each inter-censal period between 2006 -2016. The 2006 Census recorded a population figure of 506,211, rising to a recorded population figure of 527, 612 (+ 4.2 %) in 2011 with a recorded population figure of 554,554 (+5%) in Census 2016.
Table 2-1: Population Change
|
Census year |
Population |
% increase |
|
2006 |
506,211 |
|
|
2011 |
527,612 |
+4.2% over 5 years |
|
2016 |
554,554 |
+5% over 5 years |
|
2021 CSO population estimate |
600,600 |
8.3% over 5 years |
Source: CSO
The CSO’s 2021 population estimate for the Dublin Region was 1,430,000 persons. Dublin City Council’s share of the 2016 Census regional population figure for Dublin was approximately 42%. Assuming the same share for the CSO 2021 estimated regional population figure for Dublin, this gives an estimated population figure of 600,600 for Dublin City Council in April 2021. This indicates an estimated 8.3% rise in the population of Dublin City over a five year period from 2016 through to 2021.
The preliminary Census 2022 results for the administrative area of Dublin City Council in April 2022 recorded 588,233 persons. This is a preliminary increase of approximately 33,000 persons on the 2016 census of 554, 554. This equates to approximately a 6% increase in a 6 year period averaging a 1 % increase per year, in-line with previous results.
The official Census 2022 results will be published April 2023.
Housing Delivery
According to CSO New Dwelling Completions figures for Q4 2016 – Q3 2022, a full six year development plan cycle, the number of new dwellings completed in Dublin City since the adoption of the last development plan is 12,982 units, averaging 2,164 units per annum.
The Dublin Housing Task Force (DHTF) provides a quarterly update of residential planning and construction activity for the four Dublin local authorities. The DHTF figures provide a ‘snapshot’ in time that includes all extant permissions that are ‘live’ at the time the DHTF return is prepared and published.
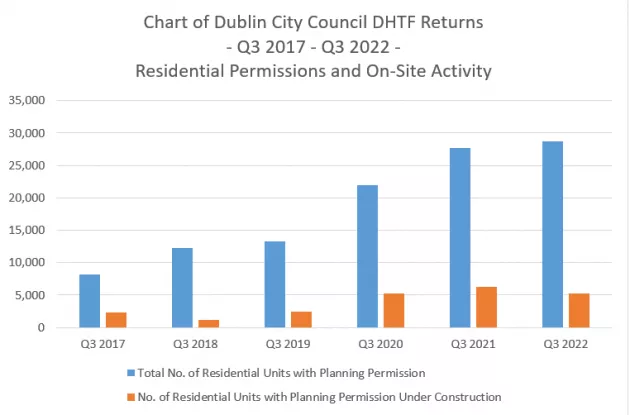
Table 2-2 below provides the most recent return, Quarter 3 2022, at the time of adoption of the plan, and the accompanying Figure 2-2 illustrates the rising volume of permissions and construction activity that has taken place over the past number of years. The figures in this chart (Figure 2-2 below) are also included as part of Table 2.4 below.
Table 2-2: Dublin City Council DHTF Returns Q3 2022
|
Planning Application Stage (Q3 2022) |
No. of Residential Units |
|
Extant Planning Permissions (permitted) |
28,777 |
|
Pending Planning Applications (proposed) |
10,580 |
|
Pre planning application consultation [PACs] (potential) |
11,778 |
Source: DHTF Returns
Figure 2-2: Chart of Dublin City Council DHTF Returns Q3 2017-Q3 2022 - Residential Permissions and on Site Activity
Source: DHTF Returns
As of Q3 2022 there were 28,777 residential units with extant permissions across the city with a further 10,580 proposed residential units pending a planning decision. In addition, there were potentially 11,778 residential units at pre planning application consultation (PACs) stage. Prior to the onset of Covid-19, Dublin City was experiencing a surge in construction activity, which was interrupted in 2020. However, current indicators show that construction activity has successfully re-opened and 2022 will demonstrate continued growth in housing construction.
Table 2-3: Dublin City Council DHTF Returns Q3 2022- Construction Site Activity
|
Sites |
No. of sites |
No. of residential units |
|
Active sites |
65 |
9,247 |
|
Non active sites |
132 |
19,530 |
|
Total |
197 |
28,777 |
Source: Source: DHTF Returns
A recurring pattern in each year is the high volume of extant permissions in comparison to sites under construction. From Table 2-3 above, as of Q3 2022, extant permissions for 19,530 residential units have yet to be activated out of a total of 28,777 extant permissions. A closer examination of the data, set out in Table 2-4, below provides further detail on the uptake of permissions.
Table 2-4: Analysis of Dublin City Council DHTF Returns Q3 2017-Q3 2022 - Ratio of Residential Permissions and on Site Activity
|
Permission / Construction |
Q3 2017 |
Q3 2018 |
Q3 2019 |
Q3 2020 |
Q3 2021 |
Q3 2022 |
|
Total No. of Extant Permissions |
8,172 |
12,298 |
13,324 |
21,989 |
27,720 |
28,777 |
|
No. of Extant Permissions Under Construction |
2,325 |
1,185 |
2,447 |
5,249 |
6,227 |
5,233 |
|
Approx. Ratio |
3.5:1 |
10:1 |
5:1 |
4:1 |
4.5:1 |
5.5:1 |
Source: DHTF Returns
The data in Table 2-4, above, shows that the level of extant permissions has more than trebled in a six-year period, from 8,172 units in 2017 to over 28,777 in 2022. This analysis also demonstrates, on a yearly average over the period tracked, that for every five residential units that gets planning permission, only one extant permission for a residential unit is under construction. The reasons for this average ratio are many, including the complex nature of site development, acquisition, land speculation and funding models in the city.
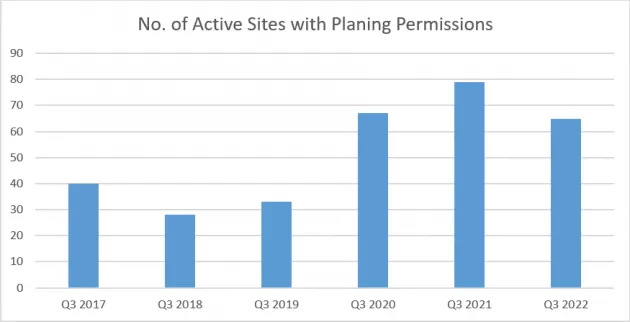
However, it is also clear that the number of sites becoming active had been steadily increasing from 40 active sites in Q3 2017 to a peak of 79 active sites in Q3 2021. The figure of 65 active sites for Q3 2022 has dropped back to a similar level (67 active sites) in Q3 2020, see Figure 2-3 below. It is expected that activity will stabilise at this level.
It is thought that awaiting the adoption of both the Sustainable Urban Housing: Design Standards for New Apartment Guidelines (March 2018), as amended in 2020 and the Urban Development and Height Guidelines (December 2018) may have influenced the timing of commitments on sites during late 2018 and early 2019, as adoption of both, brought certainty and with it, a continued increase in the number of sites becoming active.
Figure 2-3: Chart of Dublin City Council DHTF Returns Q3 2017-Q3 2022 - Active Sites
Source: DHTF Returns
2.2.2 Population and Housing Targets
Population Projections for the Core Strategy set out in the RSES and NPF
The NPF identifies a minimum target population of 1,408,000 for Dublin City and Suburbs (including all four Dublin local authority areas) by 2040, representing a 20-25% population growth range from 2016 (see Table 2-5 below).
|
Population 2016 |
Population Growth to 2040 |
Minimum Target Population 2040 |
|
|
% Range |
Number |
||
|
1,173,000 |
20 – 25% |
235,000 – 293,000 |
1,408,000 |
The RSES, guided by the National Planning Framework Implementation Roadmap, sets out population projections for the region for 2026 and 2031. These figures are set out in Table 2-6 below.
Table 2-6: RSES Population Projection for the Dublin City Council Area 2016-2031 (adjusted to comply with NPO 68)
|
2016 (CSO) |
2026 Low |
2026 High |
2031 Low |
2031 High (adjusted) |
|
554,500 |
613,000 |
625,000 |
638,500 |
655,000 |
The Dublin City Development Plan runs from 2022 until 2028. The above figures have been used to extrapolate figures aligning with the development plan period. The adjusted population for Dublin City for the year 2028 is 625,750 (Low) to 640,000 (High) persons.
Housing Supply Targets
The Department of Housing, Local Government and Heritage issued Section 28 guidelines - Projected Housing Demand by Local Authority Area 2020 – 2031 ESRI NPF Scenario Housing Supply Target of S28 Housing Supply Target Methodology for Development Planning, December 2020 - to provide planning authorities with the figures and methodology to incorporate national and regional population and housing projections into their statutory functions.
Table 2-7 below applies the approach prescribed to estimate projected housing demand for the city. The results of this approach identifies the need for 47,941 residential units from 2017 through to 2028 within Dublin City Council, which must then be refined to the development plan period, following the prescribed methodology. Estimated homeless (3,905)[2] is added to this need; and the volume of housing delivered from 2017 to 2020 (11,708) is subtracted. Using this calculation, the Housing Demand for the years 2022 to 2028, the relevant development plan period, is approximately 40,000[3] residential units for the six year period.
Table 2-7: Projected Housing Demand for Dublin City Area 2020 – 2031[4]
|
Table 2-7: Dublin City Council |
Total Households |
Number of Relevant Years |
Annual Average |
|
|
A |
ESRI NPF scenario projected new household demand 2017 to end Q4 2028[5] |
47,941 |
12 |
3,995 |
|
B |
Actual new housing supply 2017 to end Q4 2022 (actual to Q4 2020 and estimated 2021 and 2022 Q1 – Q4) |
11,708 |
6 |
1,951 |
|
C |
Homeless households (June 2021) and unmet demand (as per 2016 Census) |
3,905 |
- |
- |
|
D |
Plan Housing Demand = Total (A-B+C), (Projected ESRI NPF demand – new completions) + Unmet demand |
40,138 |
6 |
6,690 |
Summary
Based on the population targets and calculated housing need set out within national and regional planning policy, guidelines and prescribed methodology, the development plan must accommodate between 20,120 – 31,520 additional persons up to an overall population target of between 625,750 and 640,000 by 2028. The housing demand calculated sets a requirement for the development plan to provide for approximately 40,000 housing units between 2022 and 2028.
[1] NPF Table 4.1: Ireland 2040
[2]The most recent homeless figures for June 2021 taken together with the overcrowded household figure from Census 2016 to give an updated figure of unmet need (overcrowded and homeless) at 3,905.
[3] Note: this number is rounded from 40,138.
[4] Prepared in compliance with Appendix 1 of the Section 28 Guidelines: Housing Target Methodology for development Planning, December 2020.
[5] ESRI Baseline Scenario of projected new housing demand from 2017 to Q4 2022 is 47,534; almost in line with the ESRI NPF scenario included above.