Adaption Baseline
Adaption Baseline
Dublin’s energy agency Codema has produced this adaptation baseline in line with the guidelines contained in the Local Authority Adaptation Strategy Development Guidelines 2018 and the National Adaptation Framework. This Climate Change Action Plan has been peer reviewed to the requirements of the Local Authority Adaptation Strategy Development Guidelines 2018.
The objective of this baseline is to document the occurrence of past climatic events, their frequency, the specific areas in Dublin City that are most vulnerable and the risks associated with such events. This adaptation baseline also highlights the need for emergency planning to be continually updated in line with extreme weather events.
From the adaptation baseline, we can assess the current and future risks that will affect Dublin City. These risks are assessed and addressed by putting actions in place to build a more resilient City that is robust, resourceful and is able to adapt in response to changes in climate and in times of crisis. The actions are a mix of grey and green solutions, which try to balance engineered solutions with nature-based resilience. A more exhaustive list of all actions, including adaptation actions, may be found in each of the action areas contained in this Climate Change Action Plan.
Background and Methodology
Ireland has a total population of 4,761,865, of which approximately 1.9 million people live within five kilometres (km) of the coast; within this, 40,000 reside less than 100 metres away from the sea[14]. Ireland has a number of climate challenges, such as coastal flooding, sea level rise, coastal erosion, pluvial flooding, extreme weather events and extreme temperatures. Dublin, being an urban City, has different challenges and risks compared to more rural areas.
The Dublin City area is 117 km2, and comprises of 52 km of coastline, including Dublin Port and the Liffey Estuary. Three main rivers (the Liffey, the Tolka, and the Dodder) flow through the City, in addition to a number of small rivers such as the Wad, Poddle, Santry, Mayne and the Camac. Both the Poddle and Dodder run through most of the south of the City and South Dublin County; these rivers, in turn, flow into the River Liffey via the City Centre.
The River Liffey and River Camac drain areas within County Kildare, South Dublin County, the City Centre and the west side of the City, before flowing into Dublin Bay. Before discharging into Dublin Bay, the River Tolka and its tributaries drain areas within County Meath and north of the Royal Canal.
According to the most recent Census (2016)[14], the Dublin City area currently has a population of 554,554, with 240,553 households, and these figures are expected to rise in the future. The 2016 Census highlights that by 2031, population in the Greater Dublin Area (GDA) will increase by just over 400,000, and this increase would account for approximately two thirds of the total projected population growth in Ireland. A rise in population will increase the impacts of climate change due to additional pressure on drainage systems that are already working near capacity. Also, it is estimated that Ireland will need an additional 550,000 more homes by 2040, compared to 2017[4], and this will lead to a decrease in pervious or green surfaces, exacerbating flooding due to enhanced run-off.
These geographic and demographic characteristics make Dublin City sensitive to a set of climate change risks, which differ from rural, landlocked or sparsely populated regions.
As explained in the previous section, this plan follows the ICLEI Five Milestone Approach. As part of the second milestone (Research), information was collected from a range of departments to gather actions in each area. This was conducted through a series of one-to-one meetings between Codema and staff from all internal departments of Dublin City Council, and collaborative workshops with staff from all four DLAs. Additional data and information was also gathered from multiple national sources, including the Office of Public Works (OPW), Met Éireann and the Environmental Protection Agency (EPA).
Baseline
Table 1 summarises the climatic events recorded by Met Éireann that have occurred in the Dublin Region over the last 32 years. These events were recorded due to their unique intensity and abnormal weather patterns. The effects (see description) of these major events are not purely economic; they also highlight social and environmental impacts and vulnerabilities, as further described in the following sections.
| Type | Date | Description |
| Hurricane Charley | August 1986 | Pluvial – worst flooding in Dublin in 100 years. |
| Pluvial & Strong Winds | February 1990 | Heavy rain and consequently flooding, with long periods of strong winds. All weather stations reported gale gusts. |
| Pluvial/Fluvial | June 1993 |
100 mm of rain fell in Dublin and Kildare (more than three times the normal amount). |
| Extreme Temperatures | June-August 1995 | Warmest summer on record, with mean air temperatures over two degrees above normal in most places. Temperatures rose to around 30°C on a number of days and night time minimum temperature remained above 15°C for many weeks. |
| Windstorm | December 1997 | Conditions were severe in much of Leinster, especially the south and east. In the Dublin area there were record gusts of 150 km/h, with maximum 10-minute winds of storm force. |
| Fluvial | November 2000 | 250 properties flooded in Dublin, 90.8 mm of rain fell. Significant disruption and damage, especially in the area of the Lower Tolka catchment. |
| Coastal | February 2002 | Second highest tide ever recorded. This caused sea defences to be overtopped. 1,250 properties flooded in Dublin, €60m worth of damage. |
| Fluvial | November 2002 | Similar to the 2000 flood, 80 mm of rain fell in Dublin. This led to high river levels in the River Tolka, which caused extensive flooding along the catchment. |
| Extreme Temperatures | Summer 2006 | Warmest summer on record since 1995. |
| Pluvial | August-September 2008 | North City - 42.9 mm of rain fell in two hours, which was a 1-in-100-year event. 19 areas of North Dublin had severe flooding, many of which had no previous history of such flooding. Over 150 residential properties were inundated, as well as commercial premises, public buildings, major roadways, etc. |
| Pluvial | July 2009 | This was a 1-in-50-year event. Several areas within the Dublin City Council boundary were affected. One of the worst affected areas was Donnycarney in North Dublin. Reports of spot flooding in Raheny, Clontarf, Drumcondra, Finglas, Sandymount, Cabra, Finglas and Glendhu Park in Ashtown. |
| Extreme Cold | December 2010 | It was the coldest of any month at Dublin Airport, Casement Aerodrome and Mullingar in 50 years. Casement Aerodrome’s temperature plummeted to -15.7°C on Christmas Day, the lowest temperature ever recorded in Dublin. |
| Pluvial/Fluvial | October 2011 | This was between a 1-in-50 and a 1-in-100-year event across the majority of Dublin. 1,100 properties were flooded, 318 road flooding incidents occurred, 1,200 electricity customers had no power supply in the City Centre, and a fatality in the City as a result. |
| Coastal | January 2014 | The highest tide ever recorded, at 3.014 metres ODM recorded at Alexandra Basin. Four buildings flooded. |
| Storm Darwin | February 2014 | A 1-in-20-year event, with gusts of 100-110 km/h in Dublin. Considerable damage to housing and other buildings. 8,000 ha of forests damaged. Status: Yellow. |
| Storm Ophelia | October 2017 | First storm to come from a southerly direction, with damaging gusts of 120 to 150 km/h. 100 large trees blown over in Dublin City. Status: Red. |
| The Beast from the East and Storm Emma | February - March 2018 | Met Éireann issued its first Status Red warning on record for snow. Closure of all schools in the City, many businesses affected, water and power restrictions or outages. Status: Red. |
| Extreme Temperatures | Summer 2018 | Drier and warmer weather than normal throughout Ireland, with drought conditions in many areas, including Dublin. Temperatures reached 28°C, with above-average sunshine and heat wave conditions. Water restrictions were in place for the country for the majority of the summer. Status: Yellow. |
| Storms Ali and Bronagh | September 2018 | Storm Ali brought widespread, disruptive wind, which led to the delay or cancellation of most flights to and from Dublin Airport. Storm Bronagh passed over the east of Ireland bringing heavy rain. Mean wind speeds between 65-80 km/h and gusts between 110-130 km/h. Status: Orange. |
Climatic Events, Trends & Risks
Dublin City’s geographic and demographic characteristics make it vulnerable to certain risks. As a City, Dublin creates its own unique micro-climate and this can intensify current and future climate impacts. An example of this is the urban heat island effect, making it warmer than the surrounding semi-urban and rural areas. This is mainly due to heat absorption from built-up areas in the City, waste heat generated from urban activities and a lack of tree cover, which can reduce temperatures in the City through shading. Flood risks are also higher in cities due to the amount of impervious surfaces and lack of vegetation (pervious surfaces); this results in enhanced rainwater run-off, which may result in flooding.
Risks may be categorised as
- Economic loss, which includes damage to infrastructure and the disruption of daily activities
- Social loss, including damage to human life, health, community and social facilities
- Environmental and heritage loss, which takes into consideration the sensitivity of the environment (the natural, cultural and historical environment), habitats and species.
Risks in cities are exacerbated, which means we need to assess the impacts of not only extreme weather and climatic events, but also climatic trends, such as urban flooding, sea level rise and increasing temperatures. These events and trends should not be considered as independent, as they influence each other. The slow, gradual increase in temperatures and sea level rise will contribute to the increased frequency and intensity of extreme weather events and flooding.
Table 2 on the following page shows a 30-year overview of different climate variables (cold snaps, heat waves, storm surges, coastal erosion, etc.), which are grouped into three types of events and trends (extreme weather events, sea level rise and flooding). This table summarises the current effects of climate change variables, projected changes in the next 30 years, and confidence in these projections.
The climatic events and trends that Dublin City is facing are
- Extreme Weather Events
- Sea Level Rise
- Flooding
- Air Pollution and Air Quality
| Climatic Events & Trends | Parameter | Observed | Confidence | Projected Changes |
|
Extreme Weather Events |
Cold Snaps | Increasing average air temperatures may result in a decrease in the frequency of cold snaps | Medium | Projections for 2050 indicate an increase in mean annual temperature, in the range of 1-1.6 °C. This will result in milder temperatures and a decrease in the frequency of cold snaps |
| Heat Waves | Average air temperatures are increasing and may result in an increase in the frequency and intensity of heat waves | High | Eight heat waves have been recorded in Ireland over the last 30 years (more than 5 days at temperatures exceeding 25°C). Projections for 2050 predict a mean annual temperature increase of 1-1.6°C, which will intensify the temperature and duration of heat waves | |
| Dry Spells | Precipitation is becoming more seasonal and is likely to cause drier periods in the summertime | High | Ireland as a whole will experience drier summers, with a decrease of up to 20% in summer precipitation under a high emission scenario. This will result in longer periods without rainfall, which will affect water-sensitive regions and sectors | |
| Extreme Rainfall | The number of days with rainfall greater than 0.2 mm and 10 mm has gradually been increasing | Medium | The frequency of extreme rainfall is expected to keep on increasing over the years, especially in the autumn and winter seasons | |
| Wind Speeds |
Wind speeds are increasing slightly in the winter periods and decreasing over the summer time |
Low | Long term trends cannot be determined accurately; although it is anticipated that wind speed will change in a minor way, the frequency of wind storms is expected to increase in the winter periods and decrease in summer | |
| Sea Level Rise | Sea Level Rise | Seas and oceans surrounding Ireland are rising and will keep doing so | High | Future projections indicate a sea level rise of an average of 3-4 mm per year worldwide, but a 6-7 mm rise per year in Dublin Bay was recorded between the years 2000 and 2016 |
| Wave Heights | Sea waves and wave height are determined by wind speed and direction. As wind speeds and wind storms become more frequent, wave heights also increase | Medium | Projected changes in wave heights remain uncertain. However, significant wave heights (the mean height of the highest 1/3 of waves) show an increasing trend of 14 cm per decade | |
| Tides |
Increasing sea levels are resulting in record high tides (greater than 2.9 metres) |
High | Sea levels will continue to rise and will result in increased levels of high tides | |
| Storm Surges | Surges can become more frequent as extreme weather events, such as intense rainfall and high wind speeds, become more frequent | Low |
The frequency of intense cyclones and strong winds is expected to rise in the north-east Atlantic. By 2050, storm surge heights between 50 and 100 cm are likely to increase in frequency |
|
| Flooding | Coastal & Tidal | As both sea level rise and wave heights increase, the frequency of coastal and tidal flooding also increases | High | A rise in both sea levels and wave heights is projected to increase, which will lead to an increase in coastal flooding |
| Fluvial | Increased rainfall intensity, high river flows and high tides contribute to an increase in fluvial flooding | High | Projections show both high tides and the intensity of rainfall days are increasing, which, in turn, will result in an increase in fluvial flooding | |
| Pluvial |
Increased rainfall intensity will likely lead to an increase in pluvial flooding |
Medium |
It is predicted that the probability of flood events occurring will increase and the number of heavy rainfall days per year is also projected to increase, resulting in a greater risk of pluvial flooding. This is exacerbated by land use planning, including the covering up of permeable spaces, i.e. front gardens of residential properties |
|
| Groundwater | High tides and the increase in intensity of rainfall are causing groundwater levels in tidal areas to flood more frequently | Medium | It has been projected that high tides will increase as sea levels rise, as will the intensity of rainfall. Both these factors will lead to an increase in groundwater flooding |
To better understand the impact that future climate risks have on Dublin City, five impact areas were identified, which include all the different sectors in the City. These are:
- Critical infrastructure and the built environment
- Transport
- Biodiversity
- Resource Management
- Water resources
These were chosen to mirror the action areas used throughout this Climate Change Action Plan (Energy and Buildings, Transport, Nature-Based Solutions, Resource Management and Flood Resilience), which reflect DCC’s remit.
The influence of future risks on the impact areas was assessed through the use of risk matrices. Risk matrices calculate the overall future risk incurred by the different sectors in the City. The projected changes (Table 2) give an overview of the future risks that Dublin City is likely to face in the coming years.
A future risk may be defined as a product of likelihood and consequence:
Future Risk = Consequence x Likelihood
|
Critical |
5 |
| Major | 4 |
| Moderate | 3 |
| Minor | 2 |
| Negligible | 1 |
The consequences of the future risks (the level of damage caused by a climatic event or trend) range from critical to negligible consequences:
| Almost Certain | 5 |
| Likely | 4 |
| Possible | 3 |
| Unlikely | 2 |
| Rare | 1 |
The likelihood is the probability of these future risks occurring, and these range from almost certain, likely, possible, unlikely to rare:
| High Risk | [15-25] |
| Medium Risk | [7-14] |
| Low Risk | [1-6] |
Both the likelihood and consequences are given a range of ratings from one to five and the result of their product is the future risk, which can be either high (most urgent to address), medium or low risk:
Risk matrices for different climatic events and trends may be found in the risk section of Extreme Weather Events, Sea Level Rise and Flooding. A more in-depth analysis about risk matrices and the method by which they are calculated may be found in Appendix I. An additional in-depth analysis of these risks and their consequences on the delivery of the local authority’s services and functions will be carried out. Future iterations of this Climate Change Action Plan will benefit from this assessment, and this information may be gathered through the facilitation of climate change risk workshops for the four Dublin Local Authorities.
Extreme Weather Events
Dublin City has experienced an increase in extreme weather events, and this is evident from the Timeline of Major Climatic Events (Figure 4). While we cannot attribute all these events to climate change, they are the most evident consequence of climate change.
Their effects are in the form of prolonged periods of extreme cold or heat, which cause snow and heat waves, hurricane gusts due to violent winds, and heavy rainfall resulting in flooding.
Globally, temperatures are increasing and are expected to continue increasing during summer, with extreme cold spells in the winter months. Meanwhile, average precipitation is expected to decrease during the summer and autumn period, with extreme rainfalls in the winter time. The frequency of extreme wind conditions, particularly during the winter, is also expected to increase.
Baseline Assessment
Dublin City has experienced extreme weather events within the last 15 years; many of these are summarised in Table 1 earlier on in this chapter. In February and March 2018, Dublin City experienced its greatest snowfall since the winter of 1982, with depths of up to 55 cm. This was coupled with extreme cold and blizzard-
like conditions, as a result of Storm Emma coming from the Atlantic, and the ‘Beast from the East’, which also impacted most of Europe. Met Éireann issued its first-ever Status Red warning for snow nationwide, which led to severe disruption to the City for a prolonged period. The continuous heavy snowfalls and deep snowdrifts resulted in the closure of all schools across the country, while many businesses in Dublin City were forced to close, and several homes and businesses experienced power outages. High demands were placed on the country’s water network, with as many as 1.2 million households and businesses in and around the City affected by water outages or curtailments in the days after Storm Emma[15]. DCC’s Corporate Services received a total of 1,875 calls between the 28th of February and the 3rd of March, which included calls related to emergency services, heating and homeless citizens. The Dublin Fire Brigade mobilised a total of 1,354 incidents during the same period.
Dublin’s rainfall is also changing - in the last decade, the number of days with rainfall greater than 0.2 mm has been gradually increasing, as are days with over 10 mm of rain. This can be seen in Figure 5 below. Furthermore, data from Met Éireann shows that from 1961-2010, there was a 5% increase in average yearly rainfall[16,17].
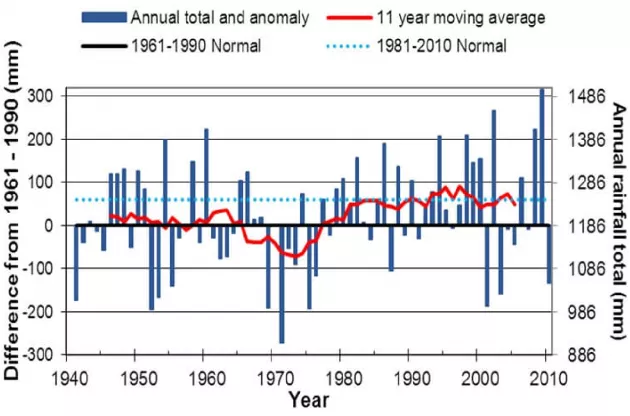
Figure 5 Annual Rainfall (1941-2010) (Source: EPA / Dwyer).
As seen in Figure 6 below, Met Éireann has already identified a 0.5°C increase in temperature, based on available data from
1961-2010, and these temperature rises are set to continue. Based on medium to low emission and high emission scenarios, “Projections indicate an increase of 1–1.6°C in mean annual temperatures, with the largest increases seen in the east of the country.”[18] This will see new challenges for Dublin City in terms of the urban heat island effect and loss of biodiversity. In addition to surface temperature, sea temperature will also increase, having an adverse effect on the marine environment.
Wind is characterised by speed and direction, which allows us to measure the strength and frequency of weather systems as they move across Ireland. Consistent wind speed data is only available for the last 15-20 years, due to changes in measurement equipment and techniques, so long term trends cannot be determined accurately[19].
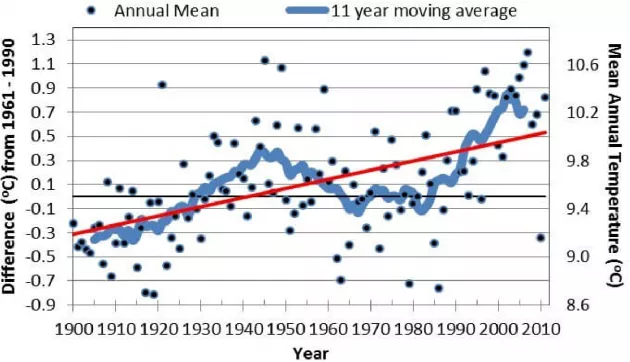
Figure 6 Mean Surface Air Temperature (1900-2011) (Source: EPA / Dwyer)
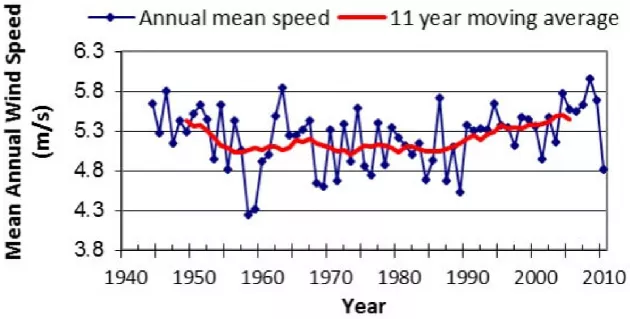
Figure 7 Dublin Airport Wind Trends (1944-2010) (Source: EPA / Dwyer)
Extreme Weather Risks
Dublin’s extreme weather risks are very much linked to the characteristics of the City. Dublin City’s temperatures are already increasing, as it experiences urban heat island effects due to its physical characteristics (e.g. prevalence of concrete buildings retaining heat) and a lack of cooling and shading from natural vegetation. Rising temperatures impact the City’s air quality, which degrades as the concentration of pollutants increase. Recently, in the summer of 2018, Ireland experienced extreme temperatures, which caused heat wave and drought conditions, and resulted in a hosepipe ban for most of the summer, due to water shortages throughout the country.
URBAN HEAT ISLANDS
Urban heat islands occur as a result of the high thermal capacity of buildings. Research has shown that built-up urban areas retain heat for longer periods of time than rural areas; consequently, urban areas are often 5 to 10 degrees warmer than rural areas.
As shown in the Timeline of Major Climatic Events (Figure 4), the frequency of extreme cold spells in Ireland has increased, and this presents additional risks to Dublin City. During Storm Emma, prolonged periods of cold resulted in water pipes freezing and then bursting as the temperatures started to rise, which left homes in the City without water.
These extreme weather events pose significant risks to critical assets such as electricity infrastructure. Violent gusts of wind during Storm Ophelia caused damage to power networks, resulting in 385,000 homes and businesses being left without electricity across Ireland. Such strong winds also put the City at risk of coastal flooding, due to sea surges caused by both sea level rise and extreme weather. Due to the characteristics of Dublin City, prolonged heavy rainfall events typically result in urban flooding, which is mainly caused by a lack of pervious surfaces. Flooding also puts groundwater supplies at risk, as these can be contaminated due to the high infiltration of flood water.
Future Risks
Met Éireann predicts that Ireland as a whole will experience wetter and milder winters, with a 10-15% increase in rainfall, and drier summers[16,17]. “Projections suggest average temperatures will continue to increase, with warming across all seasons. A warming climate may cause stresses to vulnerable populations, such as children and the elderly. This can also affect water quality and may cause pollutant contamination to surface water that may be attributed to a decrease in water flows during the warming summer and autumn months. Areas to the east are expected to see the strongest increase over the coming decades.”[17] Meanwhile, precipitation projections indicate an increase of up to 20% in heavy rainfalls during the winter and autumn seasons[17] .
Although no long-term wind speed trend can be accurately determined, it has been projected that extreme wind speeds will increase during the winter periods[17]. This would greatly affect critical infrastructure such as communication and transportation, which may be disrupted by the violent winds. Also, this increase in extreme wind events, coupled with sea level rise and coastal storms, may lead to increased wave heights and could result in habitat loss and damage, due to coastal and soil erosion.
Extreme Weather Adaption Actions
The aim of compiling extreme weather adaptation actions is to reduce the effects of these events. Some of these adaptation actions are also addressed in other sections (Flooding and Sea Level Rise).
Some of the actions that have been adopted by Dublin City Council include:
- Communication at national and local level with the general public, promoting appropriate behaviour and actions to be taken to limit impacts during extreme weather events
- Emergency planning strategies, continually aligned with extreme weather events
- Monitoring and forecasting of extreme weather events, which include accurate and timely weather-related alerts, real-time time surveillance, evaluating and monitoring
- The use of nature-based solutions (such as green roofs and SuDs) to reduce the risk of flooding arising from extreme rainfall events
- Energy-efficient buildings to ensure preparedness to extreme temperatures. DCC has an ongoing Fabric Upgrade Programme to continuously improve the efficiency of its social housing stock. Furthermore, all new developments in Ireland have to be energy efficient, and must comply with nearly Zero Energy Building (nZEB) standards after 31st December 2020 and public sector bodies must be compliant by the 31st of December 2018 for all new buildings.
| Impact Areas | Description | Parameter | Consequence | likelihood | Future Risk |
| Critical Infrastructure & the Built Environment | Projected increases in temperature, wind speeds, cold snaps and rainfall will put a stress on the built environment, particularly on critical infrastructure (such as electricity and communication networks) and residential developments (with the most vulnerable populations being particularly at risk) | Cold Snaps | |||
Sea Level Rise
The rise in sea levels in Ireland is mainly due to climate change, and the seas and oceans surrounding our island are rising at approximately 35 mm per decade[20]. The main cause of sea level rise is an increase in temperatures; as these temperatures increase, our oceans absorb more of this heat and expand. As the oceans become warmer, glaciers and polar ice caps start to melt and cause sea levels to rise.
Coastal flooding is influenced by sea level rise, and since Dublin is a coastal City, rises in sea level and coastal tides would significantly impact the City and its infrastructure. Continual rise of sea levels and the increase in the frequency, magnitude and intensity of coastal storms will further exacerbate existing complications of flooding, coastal erosion and deposition.
Coastal and estuarine flooding are both very much affected by sea level rise. Changes in sea levels will cause the extent of estuaries to increase and thus result in the infiltration of tides further upstream in rivers. This would mean that areas along rivers that are already at risk of flooding will be at increased risk of sea level rise. Rising sea levels also provide a higher base for storm surges, which increases their intensity.
Approximately 20% of Ireland’s coastline is eroding[20]. These coasts are particularly more susceptible to erosion, as they are typically made up of unconsolidated sediments, as is the case along the eastern coast (Dublin).
Baseline Assessment
Following recent extreme flood events and predictions of sea level rise due to climate change, Dublin City Council carried out a review of the capacity of the existing coastal flood defences to provide protection for urban areas. As a coastal City, Dublin is facing rising sea levels. Mean Sea Level (MSL) is the average of all the high and low tides over the course of a year. Over the last 15 years, the Annual Average Sea Level (AASL) in the Dublin Region has been rising faster than initially projected (Figure 8).
Data collected by DCC shows the AASL for the years 2014, 2015 and 2016 amounted to 78 mm, 138 mm and 114 mm Observed Difference in Mean (ODM), respectively. This compares to values in the period between 2000 and 2004, which were much closer to 0 mm ODM.
The highest tide ever recorded in Dublin City was on the 3rd of January 2014, reaching 3.014 metres at Malin Head. The second highest tide recorded was on the 1st of February 2002, at 2.950 metres at Malin Head. These were the highest tides recorded for the last 400 years, and possibly longer for Dublin Bay. To reduce vulnerability to sea level rise, a minimum safety of four metres above present sea level in the east coast of Ireland is recommended; this accounts for a rise in sea level of 0.5 metres, a storm surge of 2.95 metres, and a safety margin[21].
It is important to note that sea level rise, while an important phenomenon to understand for Dublin City, is only one element that contributes to flooding issues in the City. It is also important to understand the other elements which, when combined with rising sea levels, contribute to flooding. This includes combinations of extreme tide levels, which are made up of astronomic tides and storm surges (fluctuations in water level due to atmospheric pressure, wind speed, seiches, etc.) and wave action.
Sea Level Rise Risks
Risks associated with sea level rise can be categorised as economic, social and environmental. The risks associated with sea level rise in Dublin City include:
- Coastal deposition and damage to existing defences from increased wave heights at the coastline. This will greatly affect coastal habitats, with estuaries and wetlands particularly vulnerable
- Changes in coastal morphology, changes in sea level with an increase in intensity of coastal storms tend to exacerbate coastal erosion and deposition risk
- Salt water intrusion of groundwater with rising sea levels means that the risk of inundating groundwaters is even greater
- Increased groundwater levels in tidal regions, with more flooding of old basements
- Risks to wastewater infrastructure - sea level rise can result in overflows from combined drainage systems being unable to function, resulting in increased flood risk on land. Also, as wastewater treatment plants and sewage pumping stations are often located close to the
- coast, these facilities are at particular risk
- Damage to critical infrastructure and housing from coastal flooding and sea level rise. This results in economic and social risks to Dublin City, especially since housing and major infrastructure (roads, DART lines) are along the coast
- Increased wave heights and high tides producing damage further inland and upstream. This makes Dublin City especially vulnerable, as increased wave height and high tides can affects tidal rivers like the Liffey
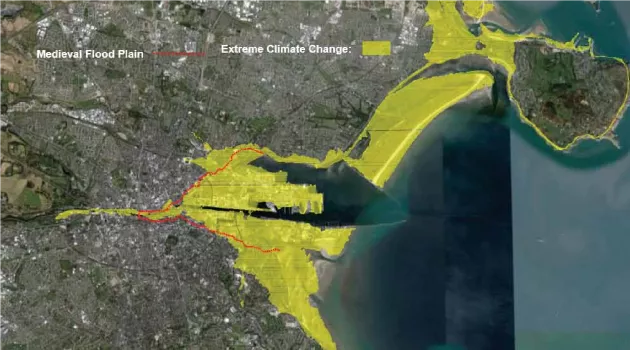
Figure 9 Areas at Flood Risk in Dublin due to Predicted Future Sea Level Rise (Source: DCC - Leahy)
Future Risks
“In terms of relative land vulnerabilities, Dublin, Louth and Wexford are at highest risk. Under a projected sea level rise of 6m, it is estimated that close to 1,200 km2 of land area would be at risk.”[17] Future projections indicate continued sea level rise will be 3-4 mm per year globally[20], but 6-7 mm per year is the recorded average sea level rise in Dublin Bay for the period between 2000 and 2016. This, coupled with increased wave heights, tides and frequency of coastal storms, means that coastal communities will face increased economic, social and environmental vulnerabilities. At the same time, intense rainfall will also see fluvial influences in the tidal area downstream.
Figure 9 on the previous page shows the coastline in Dublin City that is at risk in yellow; this is an area of economic and environmental importance to the City, as it is home to a large part of Dublin’s technology sector and the Dublin Bay UNESCO Biosphere (see case study on Page 88). An increase in temperature results in a rise in sea surface temperature, which results in the continual increase in sea level rise. A rise in sea levels also has a knock-on effect for other risks, as it increases the intensity of storm activity and wave action. Models comparing 19001961 data show that for the period between 2031-2060, storm surge heights of between 50-100 cm will increase in frequency[17]. This will make Dublin City very vulnerable, and would result in increased loss of land, damage to infrastructure and coastal flooding.
The amount of rainfall (specifically in the summer) is expected to decrease as a result of climate change, and Dublin City will become more reliant on groundwater to supply freshwater as a result.
Risk Matrix
| Impact Areas | Description | Parameter | Consequence | Likelihood | Future Risk | |
| Critical Infrastructure & the Built Environment |
|
|||||
Sea Level Rise Adaption Actions